
Fictionalized demonstration · Williamson, North Carolina
Williamson Property Screening
Ten exhibits. One clearer picture of the property. Explore how access, water, terrain, soils and planning context fit together—and which questions deserve closer investigation.
View / download the full Williamson constraint screening report (PDF; opens in a new tab)
Exhibit 01 · Parcel context
Introduction to Williamson Property
The mapped parcel provides a common frame for every exhibit that follows. GIS measurements show 23.857 acres, compared with 24.549 deeded acres in the property record. The 0.692-acre difference remains unidentified and unresolved; confirm the acreage and boundary against the original county parcel records, deed or plat, and GIS boundary used for this screening.
 EX01 · Parcel context
Open full-size image ↗ (new tab)
EX01 · Parcel context
Open full-size image ↗ (new tab)
Key takeaways
- Critical finding — acreage discrepancy: The mapped parcel measures 23.857 acres, while county records list 24.549 deeded acres. The 0.692-acre difference remains unresolved and requires confirmation against county property records.
- The 0.692-acre difference is an unidentified, unresolved discrepancy requiring review of the original county parcel records, deed or plat, and analytical GIS boundary.
- Verify legal access and boundary records with county property records. GIS measurements are not a boundary survey.
Exhibit 02 · Road proximity & access
Being near a road is not the same as having access
The mapped parcel boundary is about 98.43 feet from the Pine Hollow Road alignment. That separation raises a practical follow-up question: what connects the property to the road, and what access rights have been documented?
 EX02 · Road proximity & access
Open full-size image ↗ (new tab)
EX02 · Road proximity & access
Open full-size image ↗ (new tab)
Key takeaways
- Critical finding — road access requires confirmation: Pine Hollow Road connects toward US 401. The reported 98.43-foot gap is measured to the mapped road alignment, not a surveyed right-of-way boundary. Proximity alone does not establish legal access.
- Ask a surveyor and title adviser to check frontage, recorded easements and any intervening ownership. Proximity alone does not establish an access right.
Exhibit 03 · Hydrology
Follow the water through the property
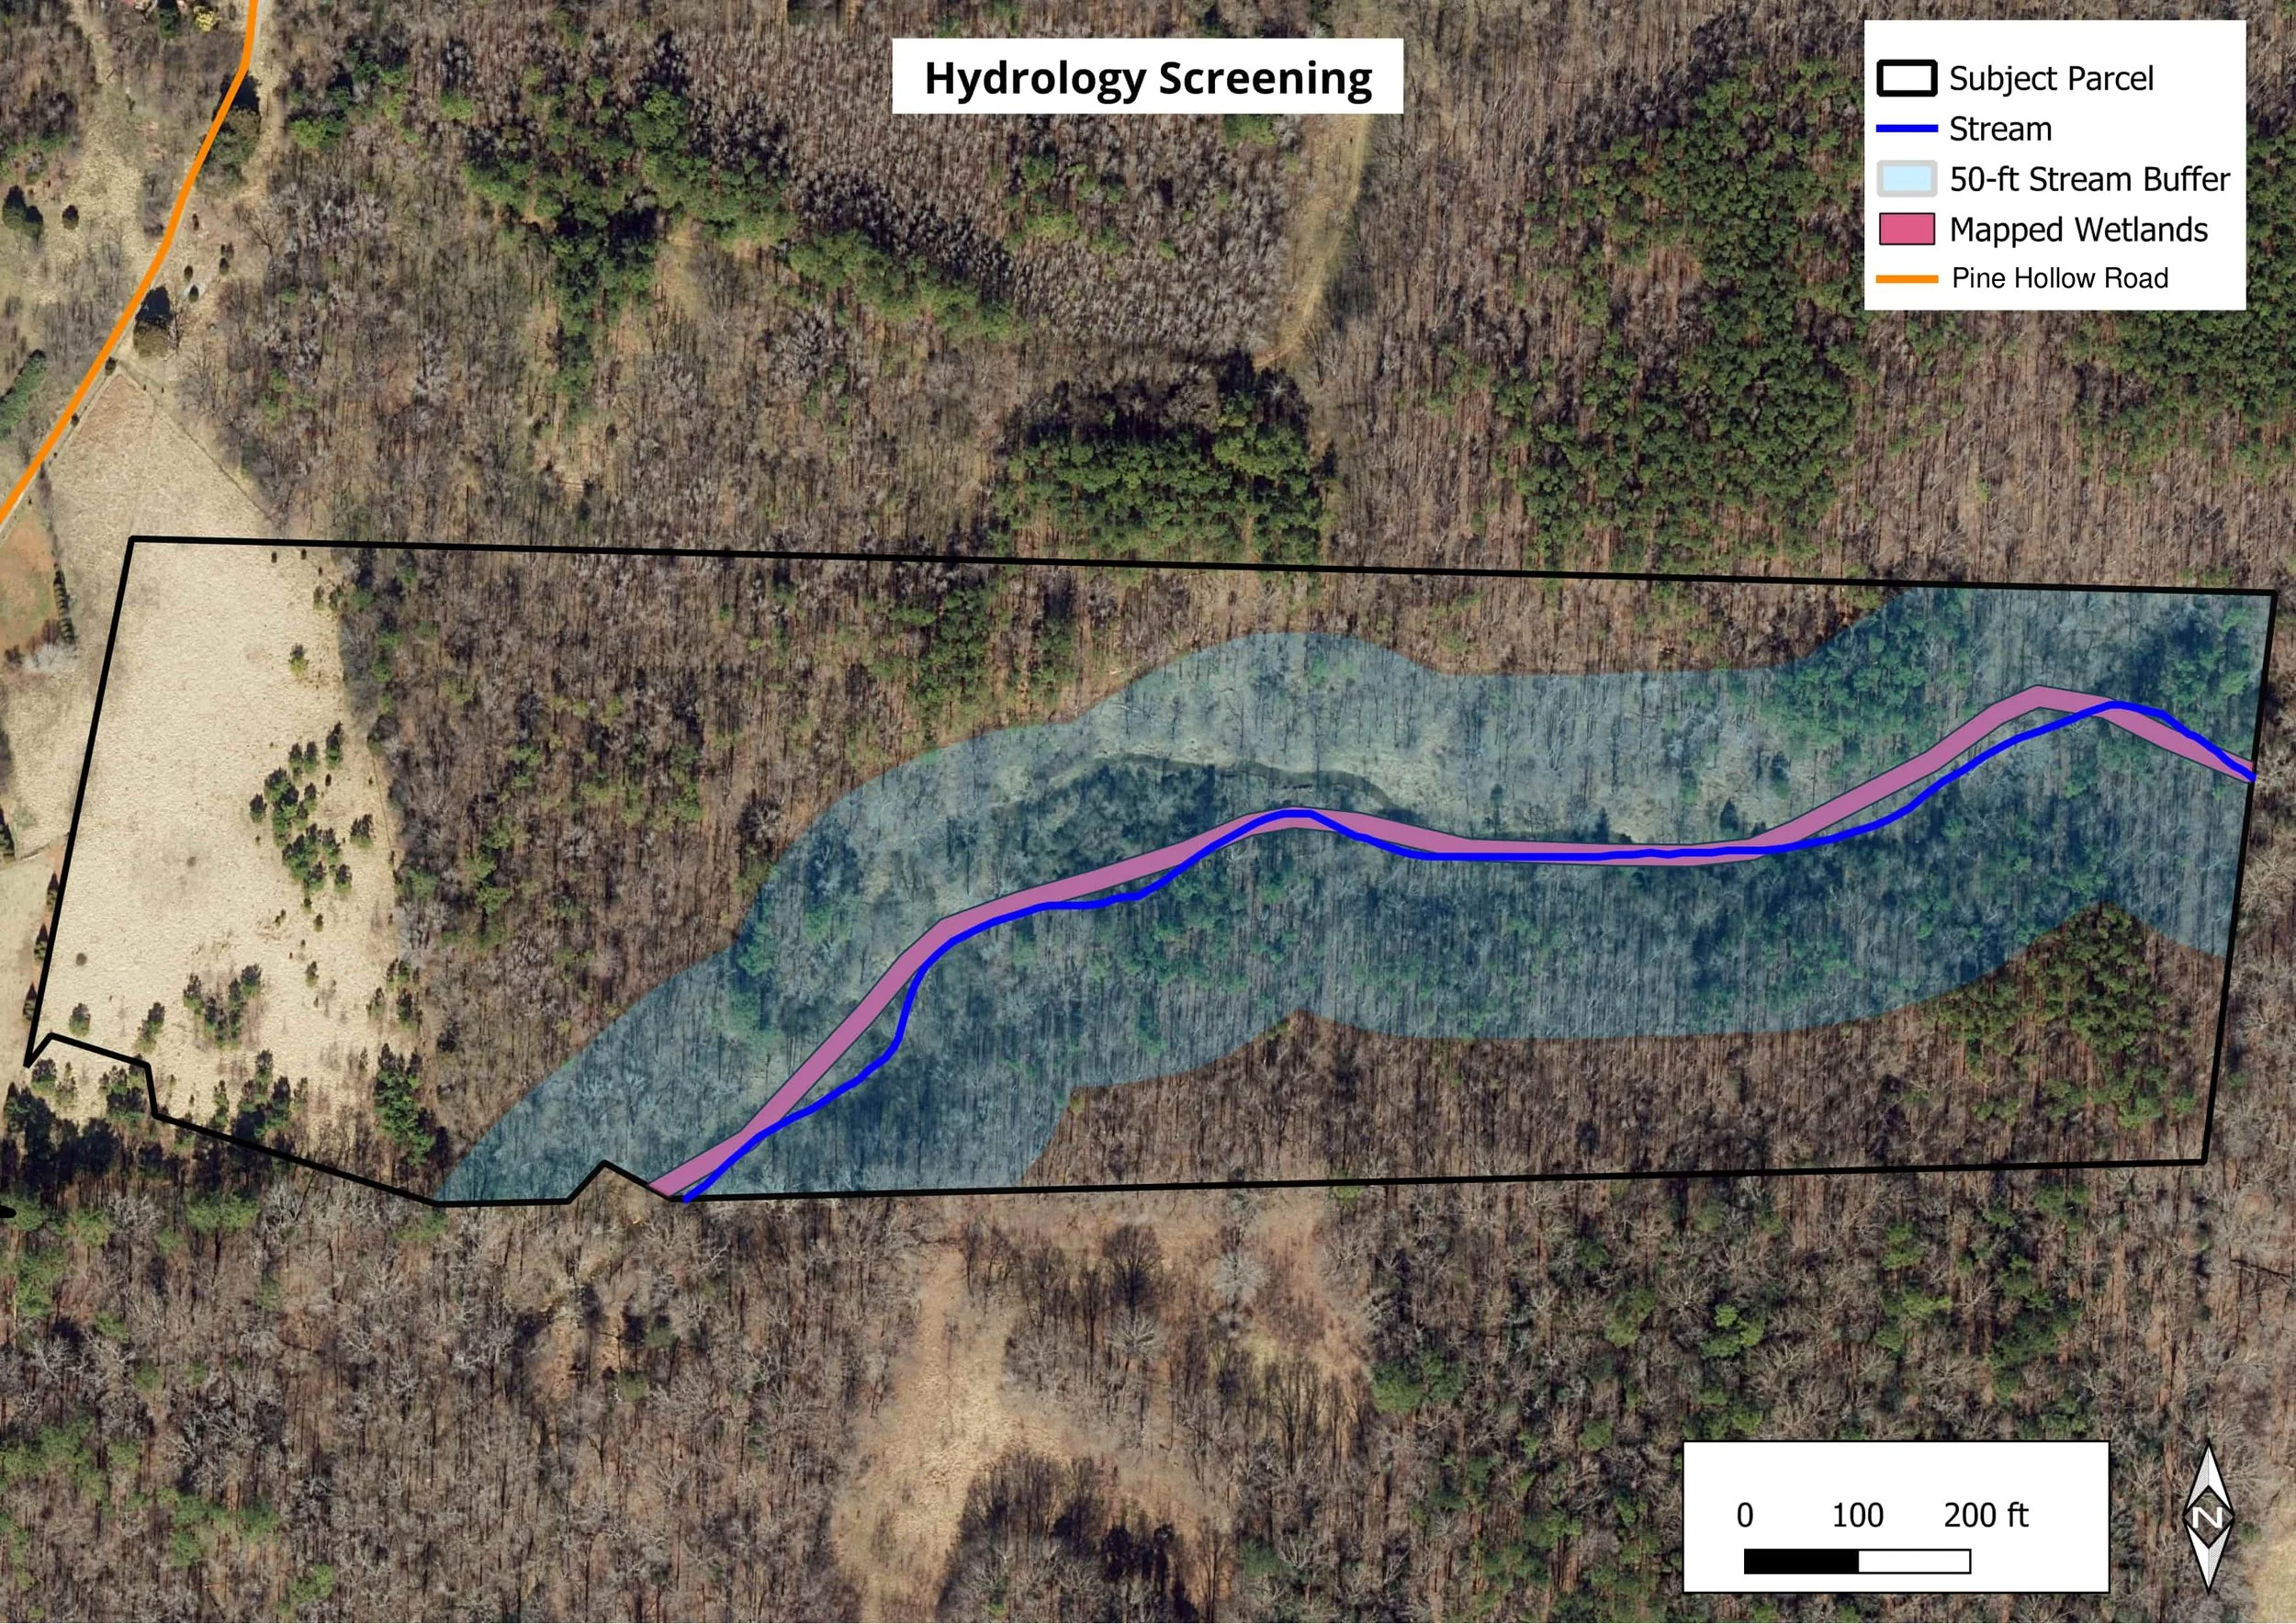
A stream, mapped wetlands and a 50-foot stream buffer form a connected corridor across the parcel. Seeing these features together helps identify where field review and more detailed investigation should be focused.
 EX03 · Hydrology
Open full-size image ↗ (new tab)
EX03 · Hydrology
Open full-size image ↗ (new tab)
Key takeaways
- The stream and wetland pattern helps identify where water-related conditions may affect a site layout.
- The 50-foot buffer is a screening choice, not a verified regulatory requirement. Field delineation and agency or local review are needed to confirm wetland limits, stream classification, jurisdiction and required buffers.
Exhibit 04 · Terrain & slope
Locate the steeper ground before planning around it
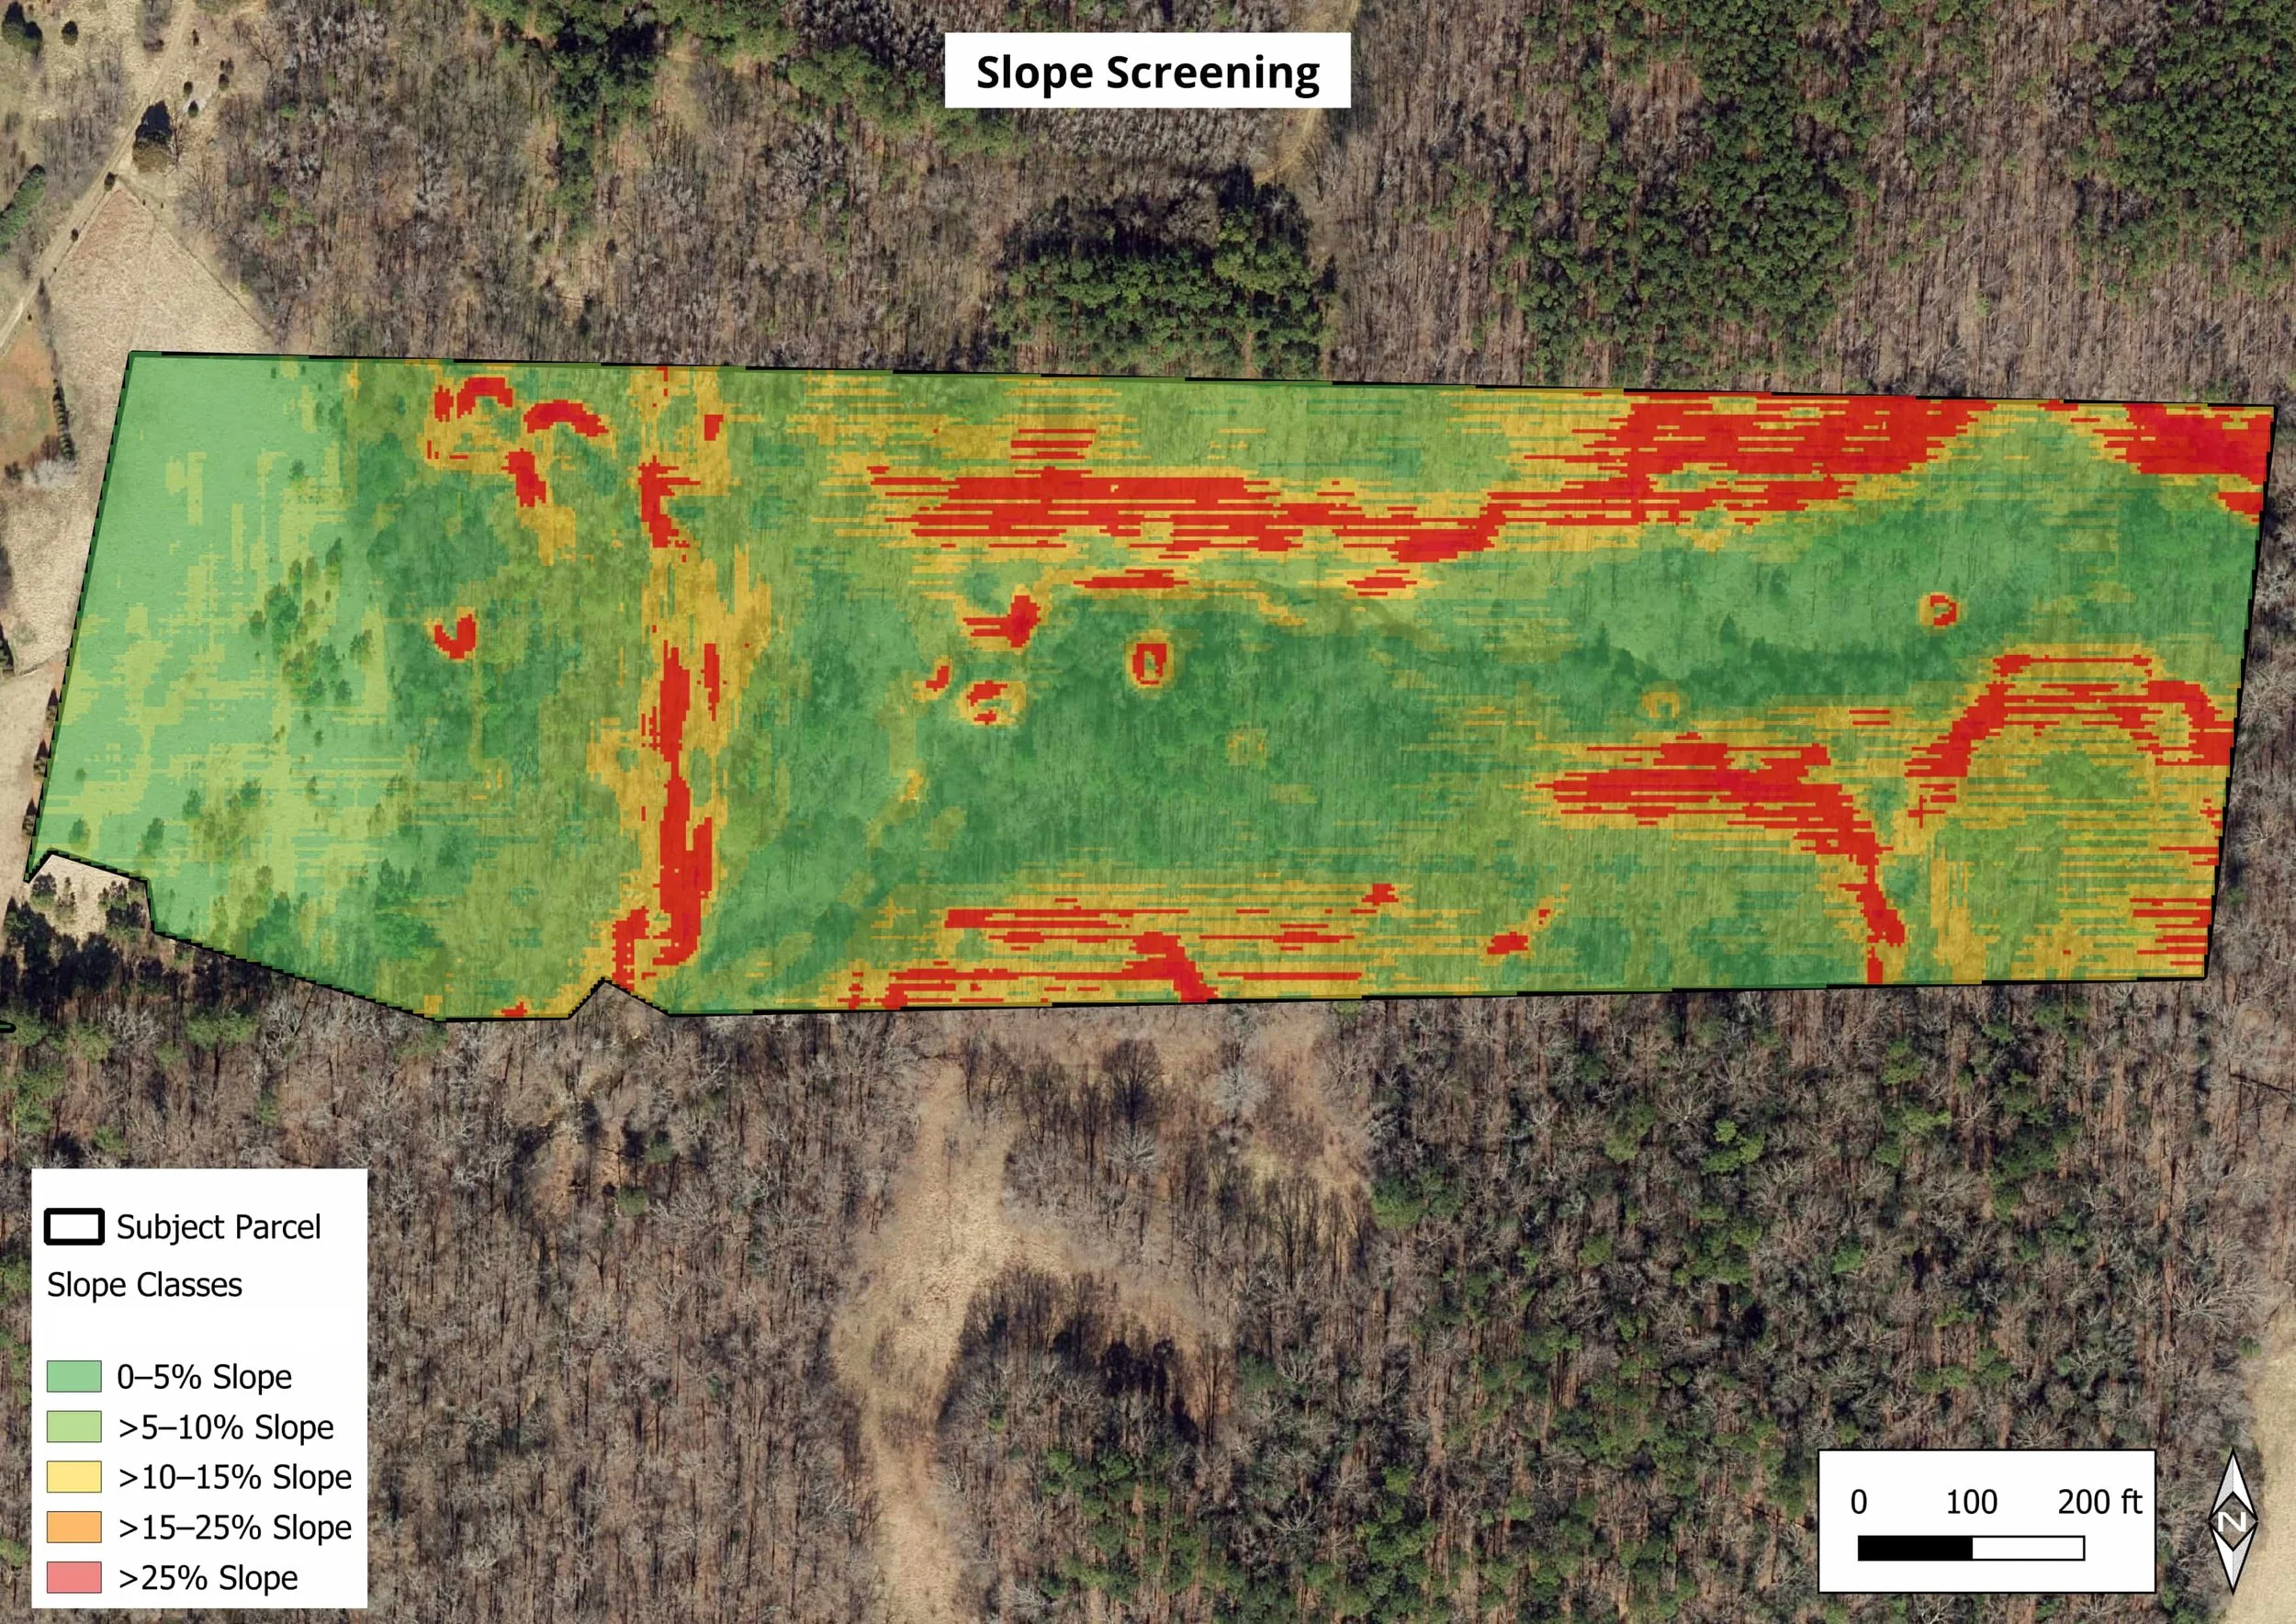
About 2.65 acres, or 11.1% of the classified parcel, exceed 15% slope. The map shows where those areas are distributed, helping frame questions about site layout, grading and further topographic investigation.
 EX04 · Terrain & slope
Open full-size image ↗ (new tab)
EX04 · Terrain & slope
Open full-size image ↗ (new tab)
Key takeaways
- Steeper areas may affect site planning: Slopes above 15% appear in several areas of the parcel and may influence grading, access, layout and erosion control.
- Confirm terrain before design: The mapped slopes depend on the elevation data, and its level of detail can vary from model to model. Obtain a site-specific topographic survey before making design decisions.
How to read the slope acreage
About 2.65 acres (11.1%) exceed 15% slope. About 0.21 acre (0.9%) exceeds 25% slope and is included in the larger figure.
The area above 25% slope is already included in the area above 15%; do not add them together. The same rule applies to other overlapping layers.
Exhibit 05 · NRCS soil screening
Are soil conditions right for the intended use
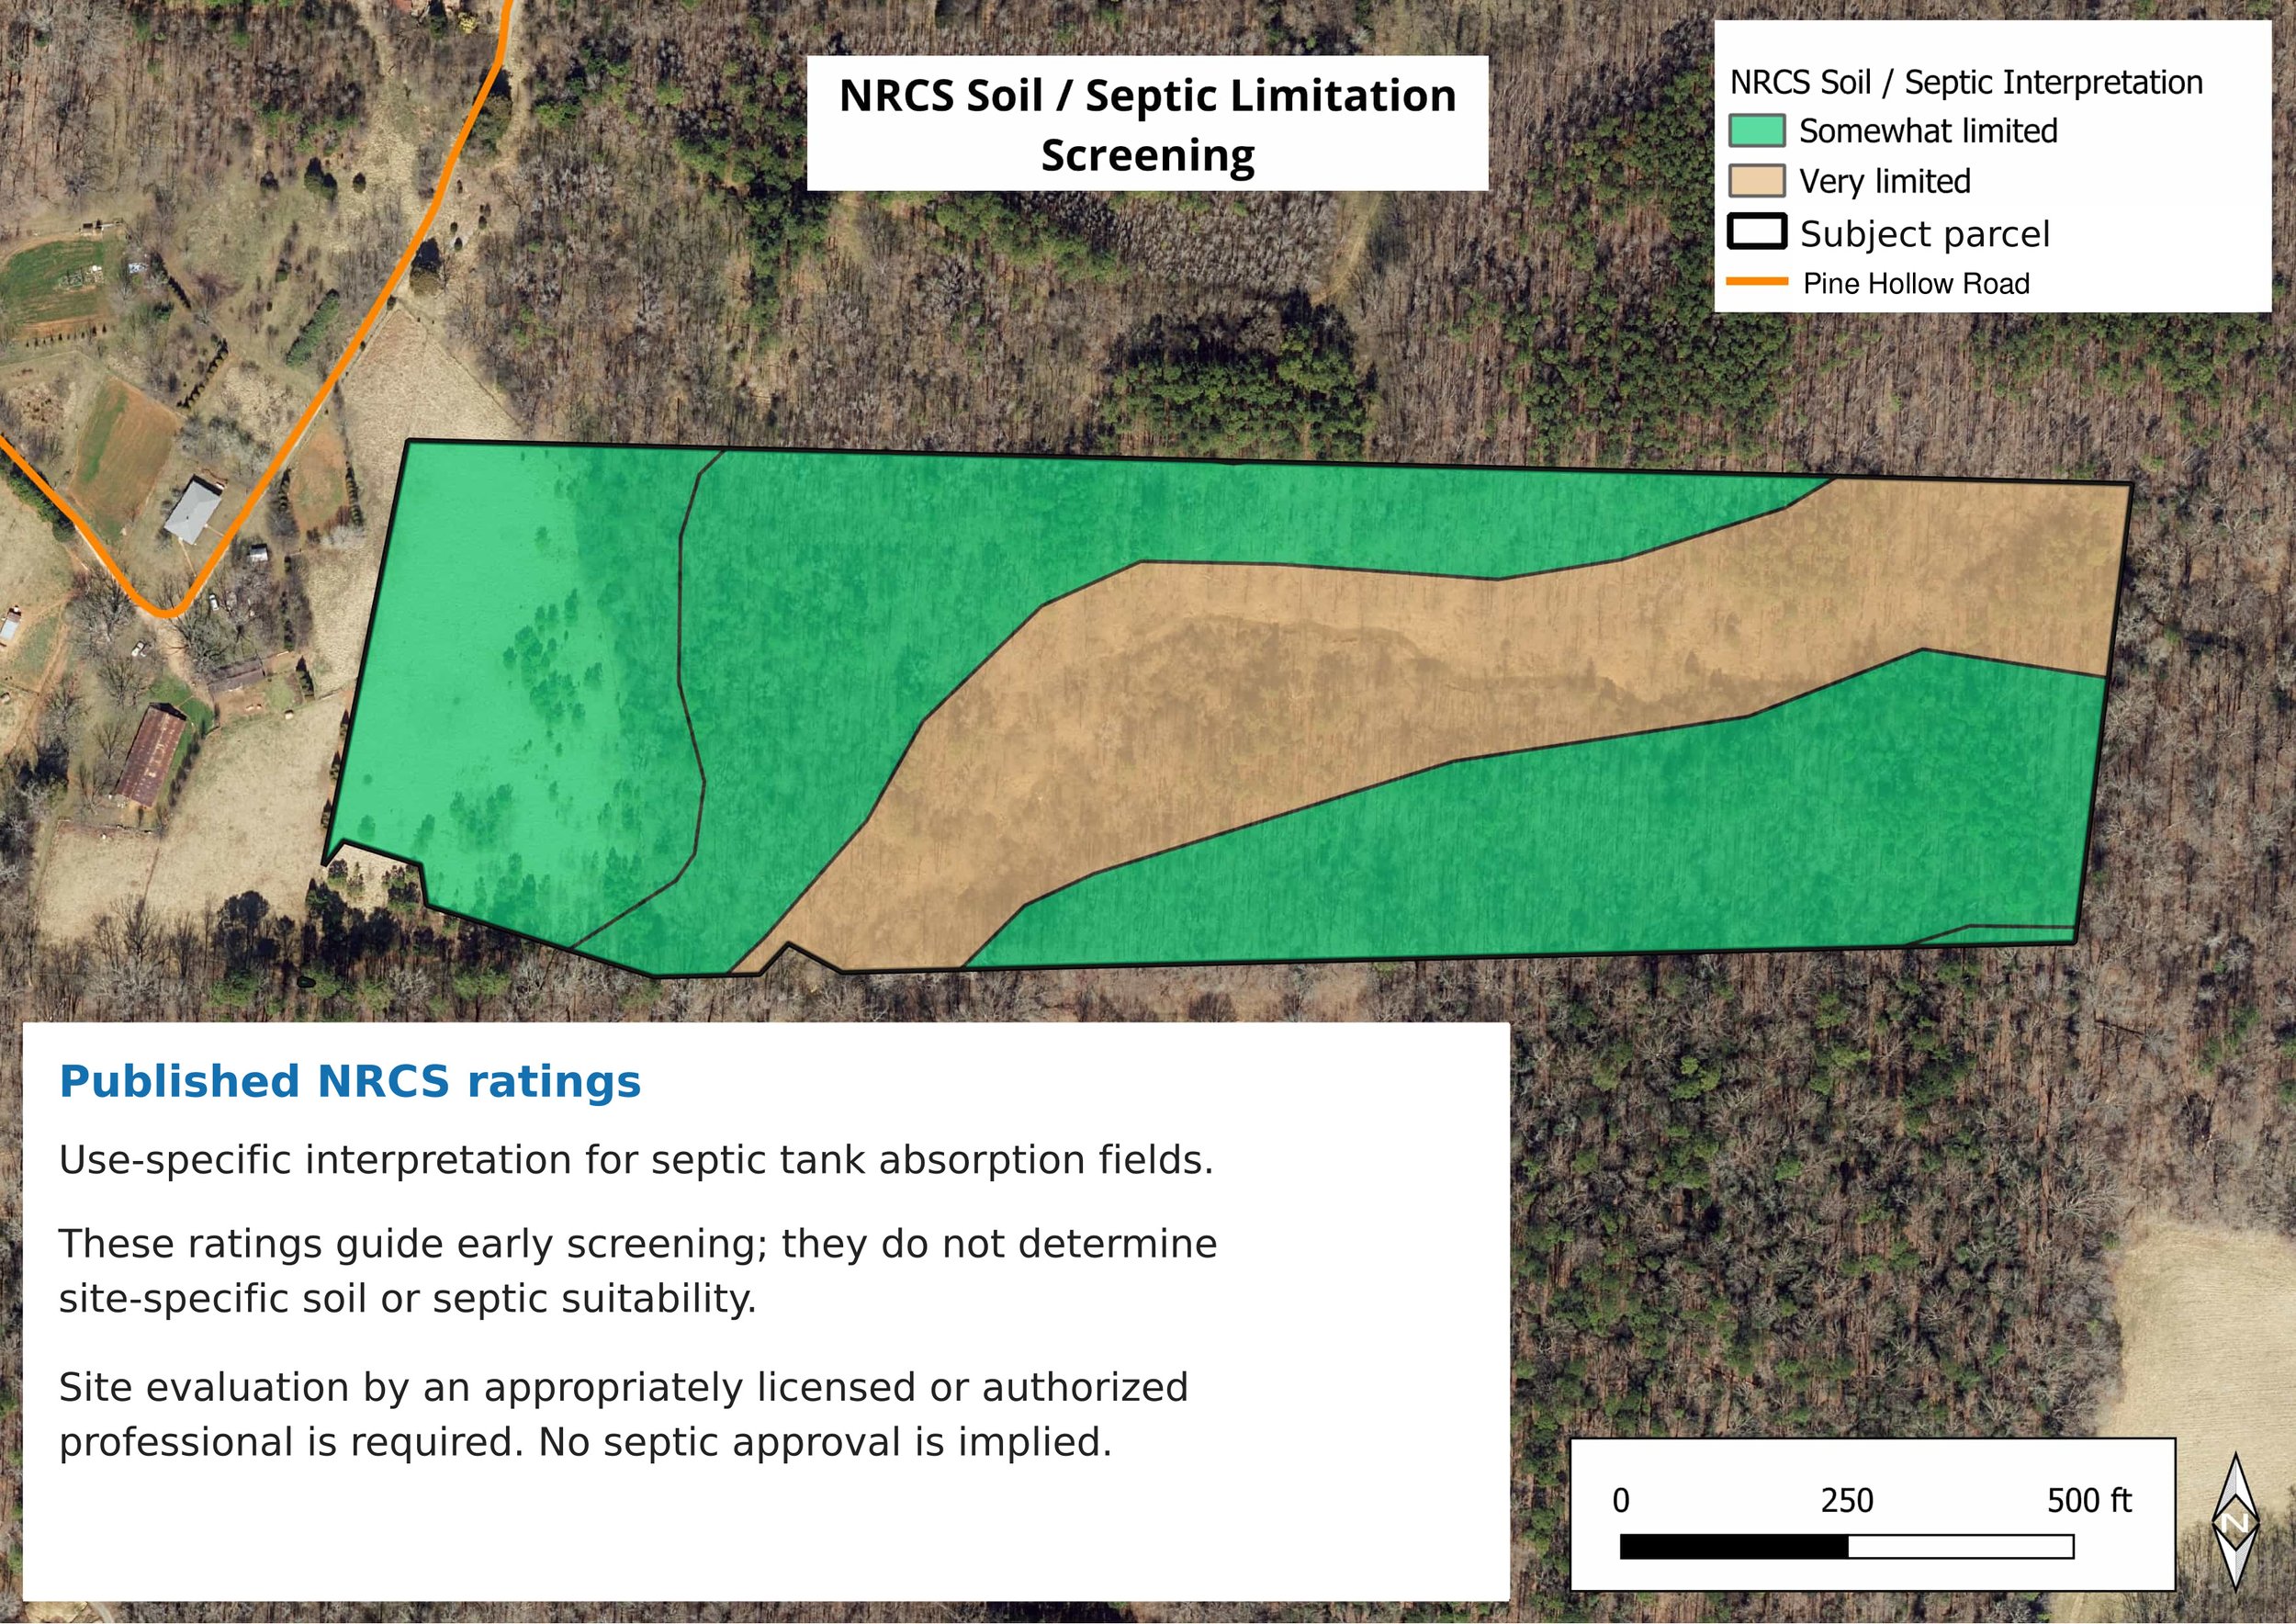
For septic tank absorption fields, published NRCS ratings map 7.89 acres (33.1%) as Very Limited and 15.97 acres (66.9%) as Somewhat Limited. These ratings help identify where further soil and wastewater evaluation is needed
 EX05 · NRCS soil screening
Open full-size image ↗ (new tab)
EX05 · NRCS soil screening
Open full-size image ↗ (new tab)
Key takeaways
- This analysis and map utilize published USDA Natural Resources Conservation Service (NRCS) ratings for septic tank absorption fields. “Very Limited” is the source rating, not a GISLens permit decision.
- An independent evaluation of the underlying soil properties by an appropriately licensed or authorized professional must assess the site and wastewater needs.
How to read the soil ratings
EX05 rates soils for septic tank absorption fields: the part of a septic system that distributes effluent from a septic tank into the soil. The colors show published limitations for that particular use, not soil names or an overall development-suitability score.
| Displayed item | Plain-English meaning | Reading for this property |
|---|---|---|
| Somewhat LimitedGreen | Moderately favorable soil features for septic absorption fields. Limitations may need special planning, design or installation. | 15.97 acres (66.9%) carry this rating. Green does not mean “Not Limited,” approved, or ready for a drainfield. |
| Very LimitedTan | One or more unfavorable soil features. Resolving the limitations generally requires major soil changes, special design or costly installation. | 7.89 acres (33.1%) carry this rating. The class identifies a stronger screening concern; it is not a permit denial or a system design. |
| Subject parcelBlack outline | The mapped boundary used to clip and summarize the soil-rating areas. | The analytical denominator is 23.857 acres. It is distinct from the 24.549-acre property-record figure. |
| Pine Hollow RoadOrange line | Road context used to orient the map. | The line is not a soil class and does not establish frontage or legal access. |
How to read the acreage
The percentages describe mapped land area, not failure probabilities or soil-component percentages. For example, 7.89 ÷ 23.857 × 100 ≈ 33.1%. The two rounded acreage totals add to 23.86 acres, consistent with the mapped boundary. Neither category identifies approved drainfield acreage.
What the rating does not tell you
Ratings can differ for other uses, such as buildings or excavations. EX05 does not identify the underlying soil series or rating aggregation method. Consult the underlying NRCS records for those details and use site investigation to confirm local soil conditions.
USDA NRCS information is screening-level only, not a site-specific soil, geotechnical, engineering, geological, septic-suitability or regulatory determination. It does not establish septic approval, design, capacity, drainfield suitability or permit eligibility.
Exhibit 06 · Combined constraints
See how the selected constraints fit together as a whole across the property
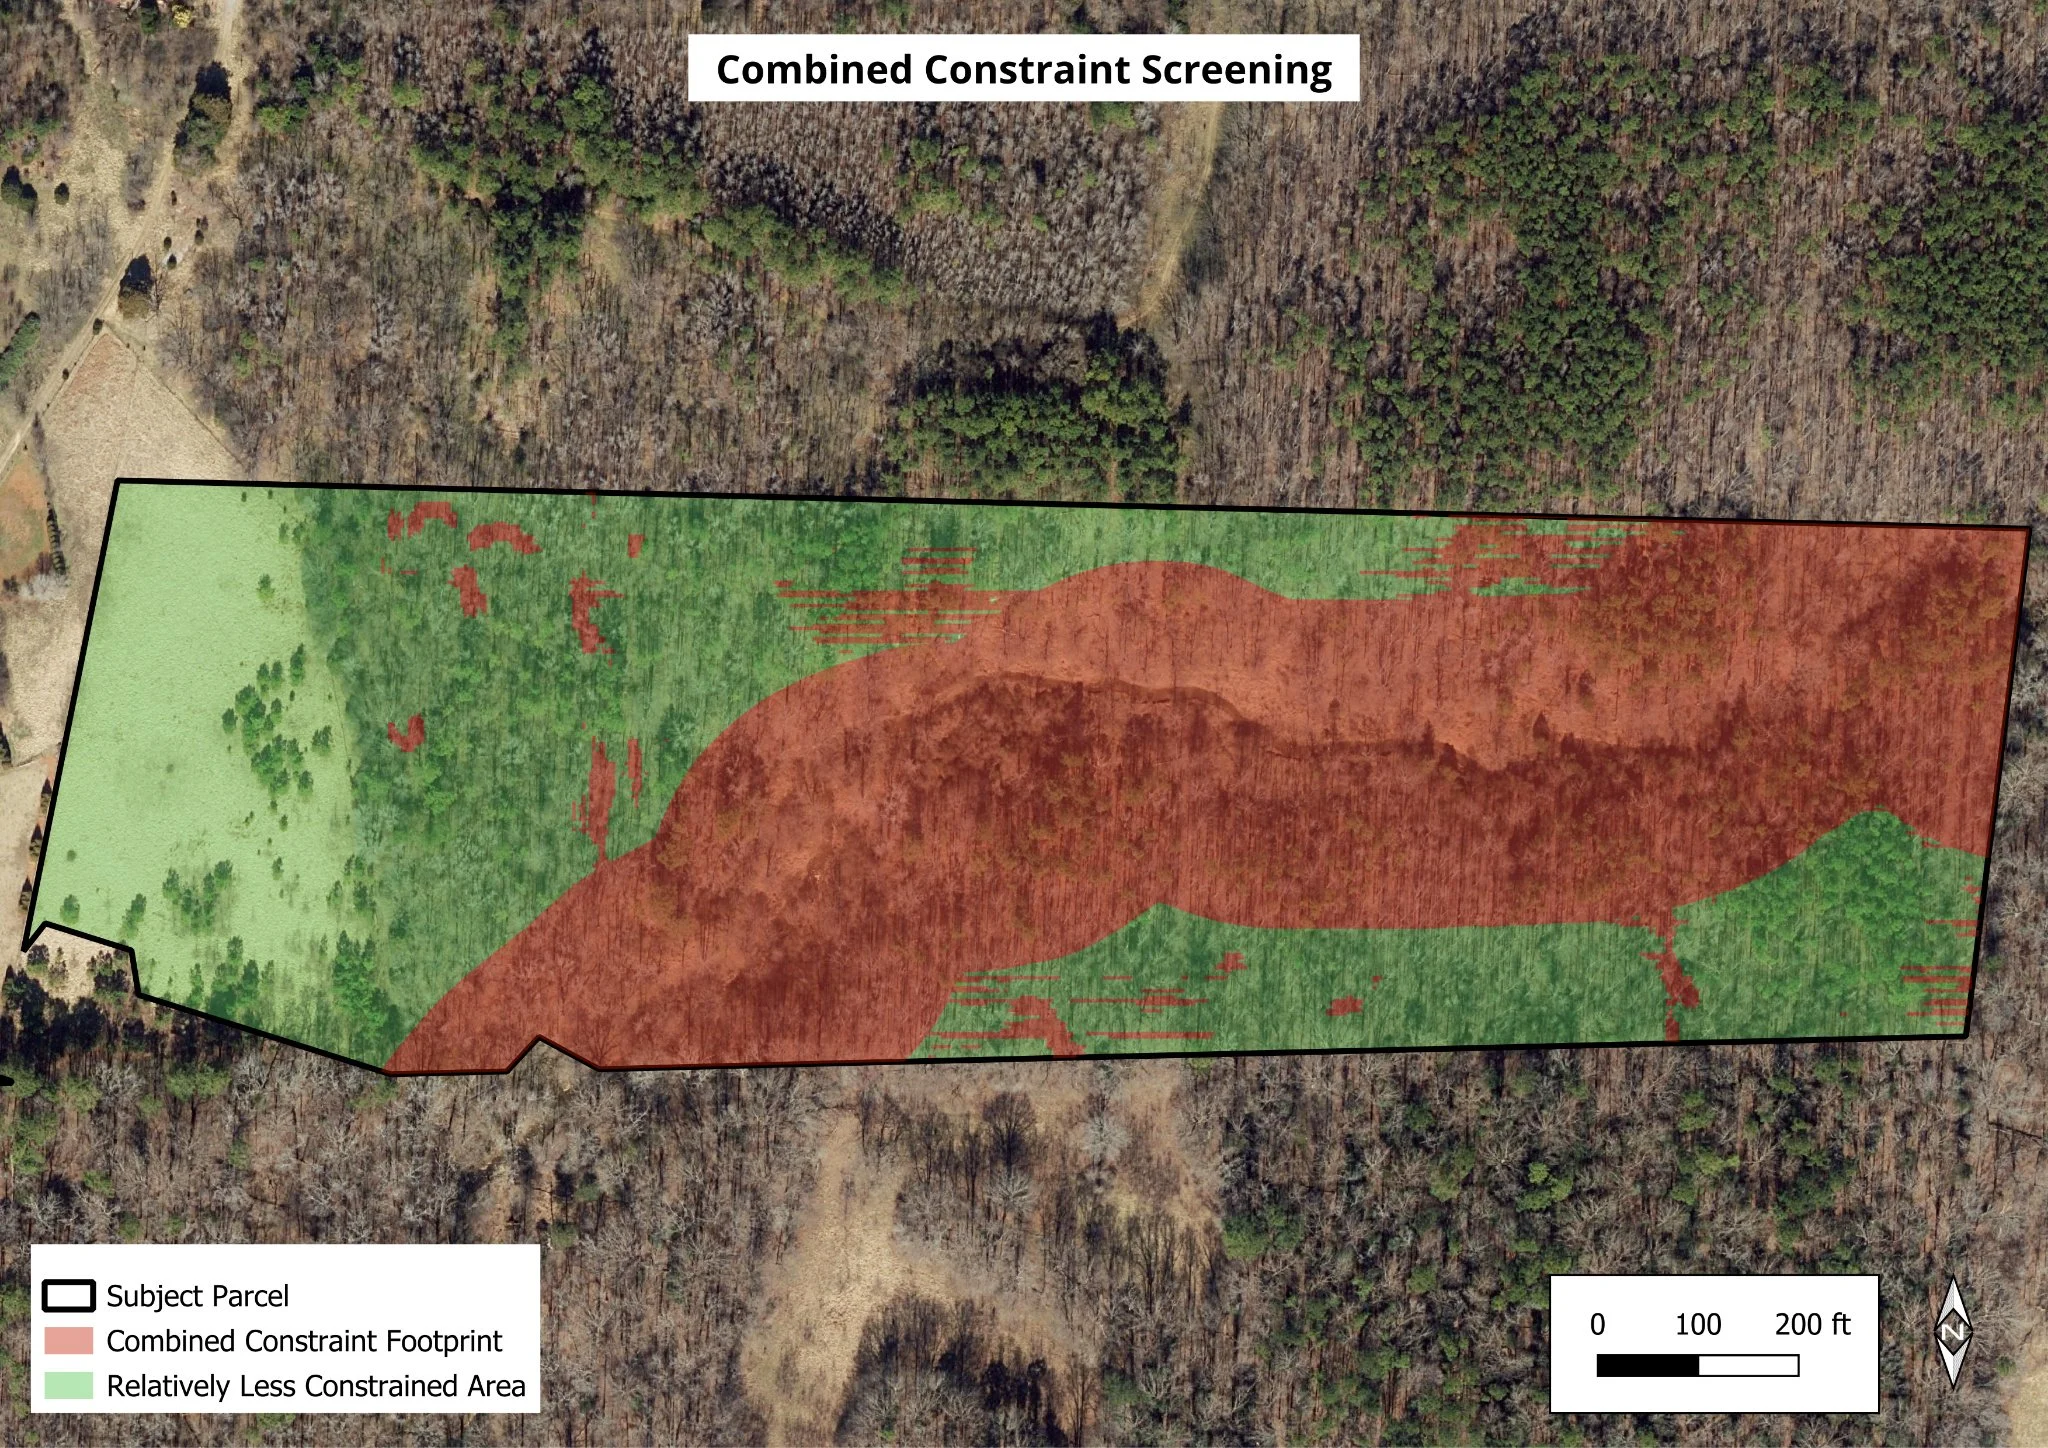
This exhibit combines mapped wetlands, the 50-foot analytical stream buffer and slopes above 15%. The combined footprint helps focus investigation in further usability design
 EX06 · Combined constraints
Open full-size image ↗ (new tab)
EX06 · Combined constraints
Open full-size image ↗ (new tab)
Key takeaways
- The overlapping layers form a broad corridor, mainly across the central and eastern parcel.
- Areas outside the mapped constraints provide a starting point for exploring potential site layouts and prioritizing further investigation.
How to read the combined footprint
Wetlands, the 50-foot stream buffer and slopes above 15% were merged into one combined area so the total constrained area can be visualized as a percentage of the property.
Exhibit 07 · FEMA flood screening
A negative finding is what you want!
No mapped FEMA flood-hazard feature intersected the parcel in the data reviewed. This exhibit documents the negative finding result for that particular screening.
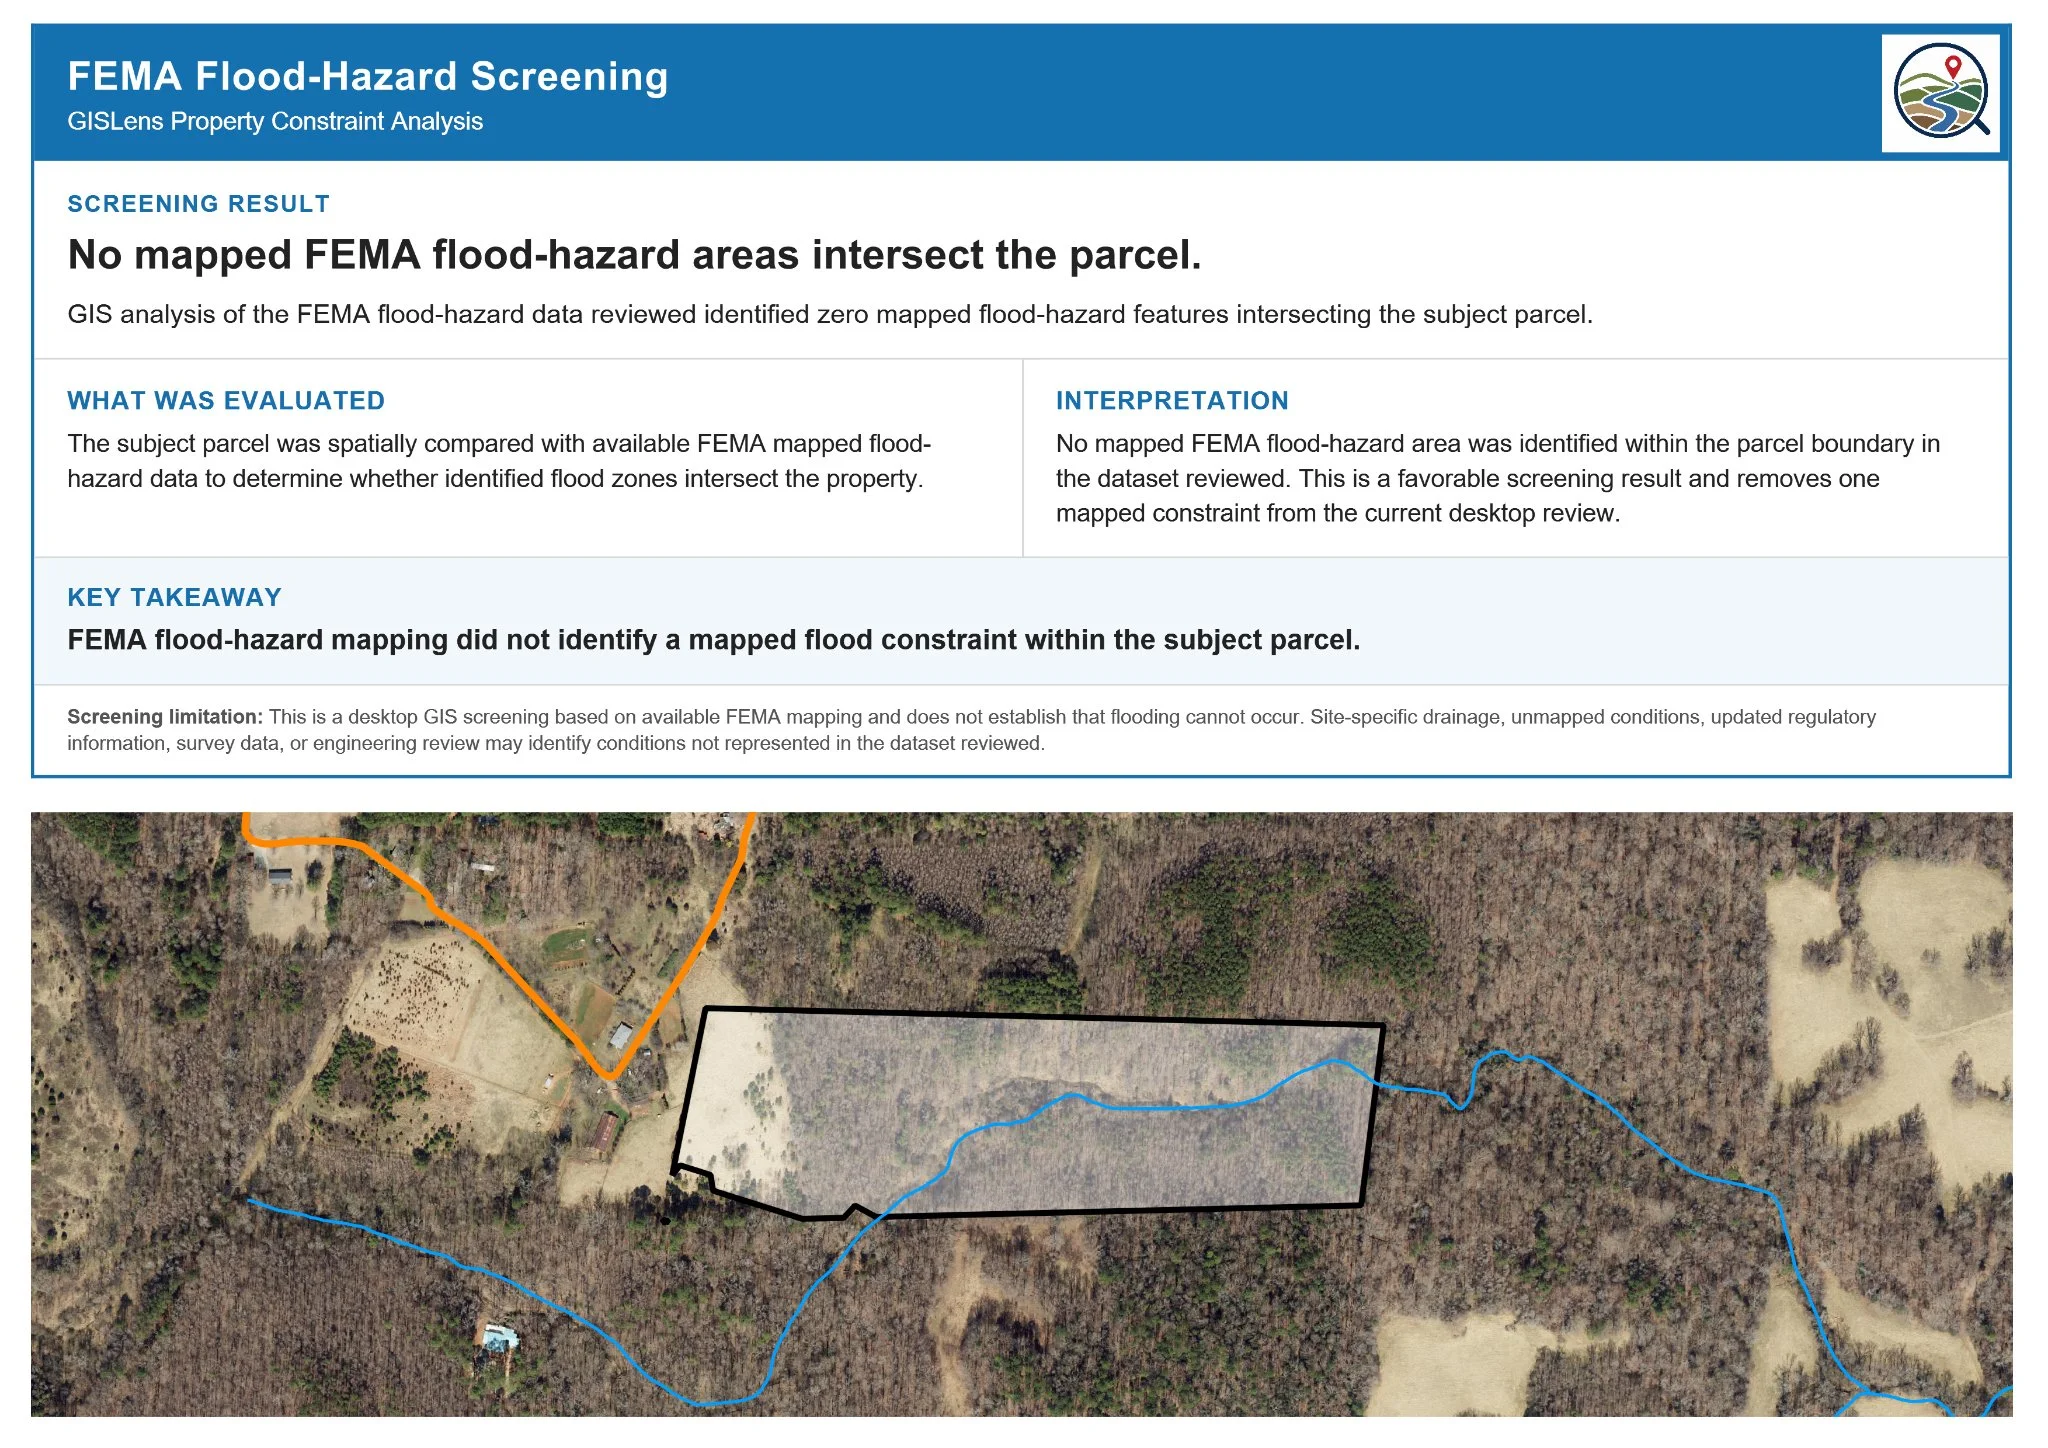 EX07 · FEMA flood screening
Open full-size image ↗ (new tab)
EX07 · FEMA flood screening
Open full-size image ↗ (new tab)
Key takeaways
- No reviewed FEMA flood-hazard feature overlapped the parcel.
- Before a property or design decision, confirm current flood information and assess drainage using appropriate engineering information.
How to read the flood screening exhibit
Map key: black outline = parcel; orange = Pine Hollow Road; blue = stream. No flood depths are modeled.
Exhibit 08 · Federal critical habitat
Establish a clear starting point for habitat review
The reviewed U.S. Fish and Wildlife Service (USFWS) maps show no overlap between the parcel and final or proposed federal critical habitat. This provides a documented answer to one part of the environmental review and helps focus further investigation on the property’s specific habitat conditions.
 EX08 · Federal critical habitat
Open full-size image ↗ (new tab)
EX08 · Federal critical habitat
Open full-size image ↗ (new tab)
Key takeaways
- Documented screening result: No final or proposed federal critical habitat overlaps the parcel in the reviewed USFWS layers.
- More focused follow-up: Use this result alongside the stream and wetland findings to plan site-specific habitat review around the intended activity and the areas it could affect.
How to read the habitat screening exhibit
The results panel summarizes final and proposed critical habitat intersections. On the location map, the black outline marks the parcel, orange identifies Pine Hollow Road, and blue shows the stream.
Exhibit 09 · Current zoning
Identify the zoning context—and what still needs confirmation
In this fictionalized demonstration, the reviewed zoning layer maps the parcel R-A2 (Residential-Agriculture, 2 Acres) within Williamson’s extraterritorial jurisdiction (ETJ). The exhibit establishes a starting point for checking district standards, overlays and property-specific conditions.
 EX09 · Current zoning
Open full-size image ↗ (new tab)
EX09 · Current zoning
Open full-size image ↗ (new tab)
Key takeaways
- R-A2 is named Residential-Agriculture, 2 Acres in the reviewed Williamson layer. Nearby town and County districts show the wider setting; they do not change the subject parcel’s mapped classification.
- Confirm current zoning, allowed uses, dimensional standards, overlays and conditions with the responsible jurisdiction. The district label alone does not establish development rights or the number of lots that could be approved.
Exhibit 10 · Future land use & planning
Understand future land use for the property and surrounding properties
The surrounding future-land-use framework includes conservation, rural, parks and protected land, and a nearby Village Center. The parcel is shown within the Williamson ETJ, which identifies jurisdiction rather than a future land-use designation.
 EX10 · Future land use & planning
Open full-size image ↗ (new tab)
EX10 · Future land use & planning
Open full-size image ↗ (new tab)
Key takeaways
- The ETJ is Williamson’s extraterritorial jurisdiction. It identifies jurisdiction, not the parcel’s future zoning or an assigned future land-use category.
- The map shows surrounding Conservation, Rural, Parks and Protected Land, and Village Center categories. The original exhibit marks about 0.45 mile to a planned Village Center.
- That proximity provides planning context; it does not establish infrastructure availability, permitted uses or development rights. Confirm the policy that applies to the parcel.
Your property. Your next questions.
Start with a clearer picture
Request a free property report for an initial review of available property information and recommendations for deeper GIS screening. If you already have a specific question or need additional analysis, let’s discuss it.
View / download the Williamson report (PDF; opens in a new tab)
The free report’s scope is described on the request page; this ten-exhibit demo is a separate project example.