
Overview / Road Proximity: What does the data look like? What’s around and how easily can the parcel be accessed?
Property Boundaries & Access
See the mapped parcel boundary, acreage, nearby road, and the separation that makes frontage and legal access important follow-up questions.
View this section →Water & Environmental
Identify mapped wetlands, streams, screening buffers, and other water-related features that may warrant closer review.
View this section →Terrain & Slope
See where steeper terrain may affect access, grading, construction, erosion control, or site-planning decisions.
View this section →Soils & Septic Screening
Compare mapped soil limitations and identify areas that may warrant closer review for septic use and site planning.
View this section →Combined Constraints
Bring the individual screenings together to reveal where constraints overlap and where the property appears relatively less constrained.
View this section →Subject Parcel*: Mapped parcel geometry, acreage, road relationship, and site features establish the baseline for the screening analysis.
Hydrology Screening: Mapped wetlands, stream location, and a 50-ft screening buffer shown in relation to the subject parcel.
Slope Screening: Parcel-wide slope classes with areas over 15% highlighted for closer review.
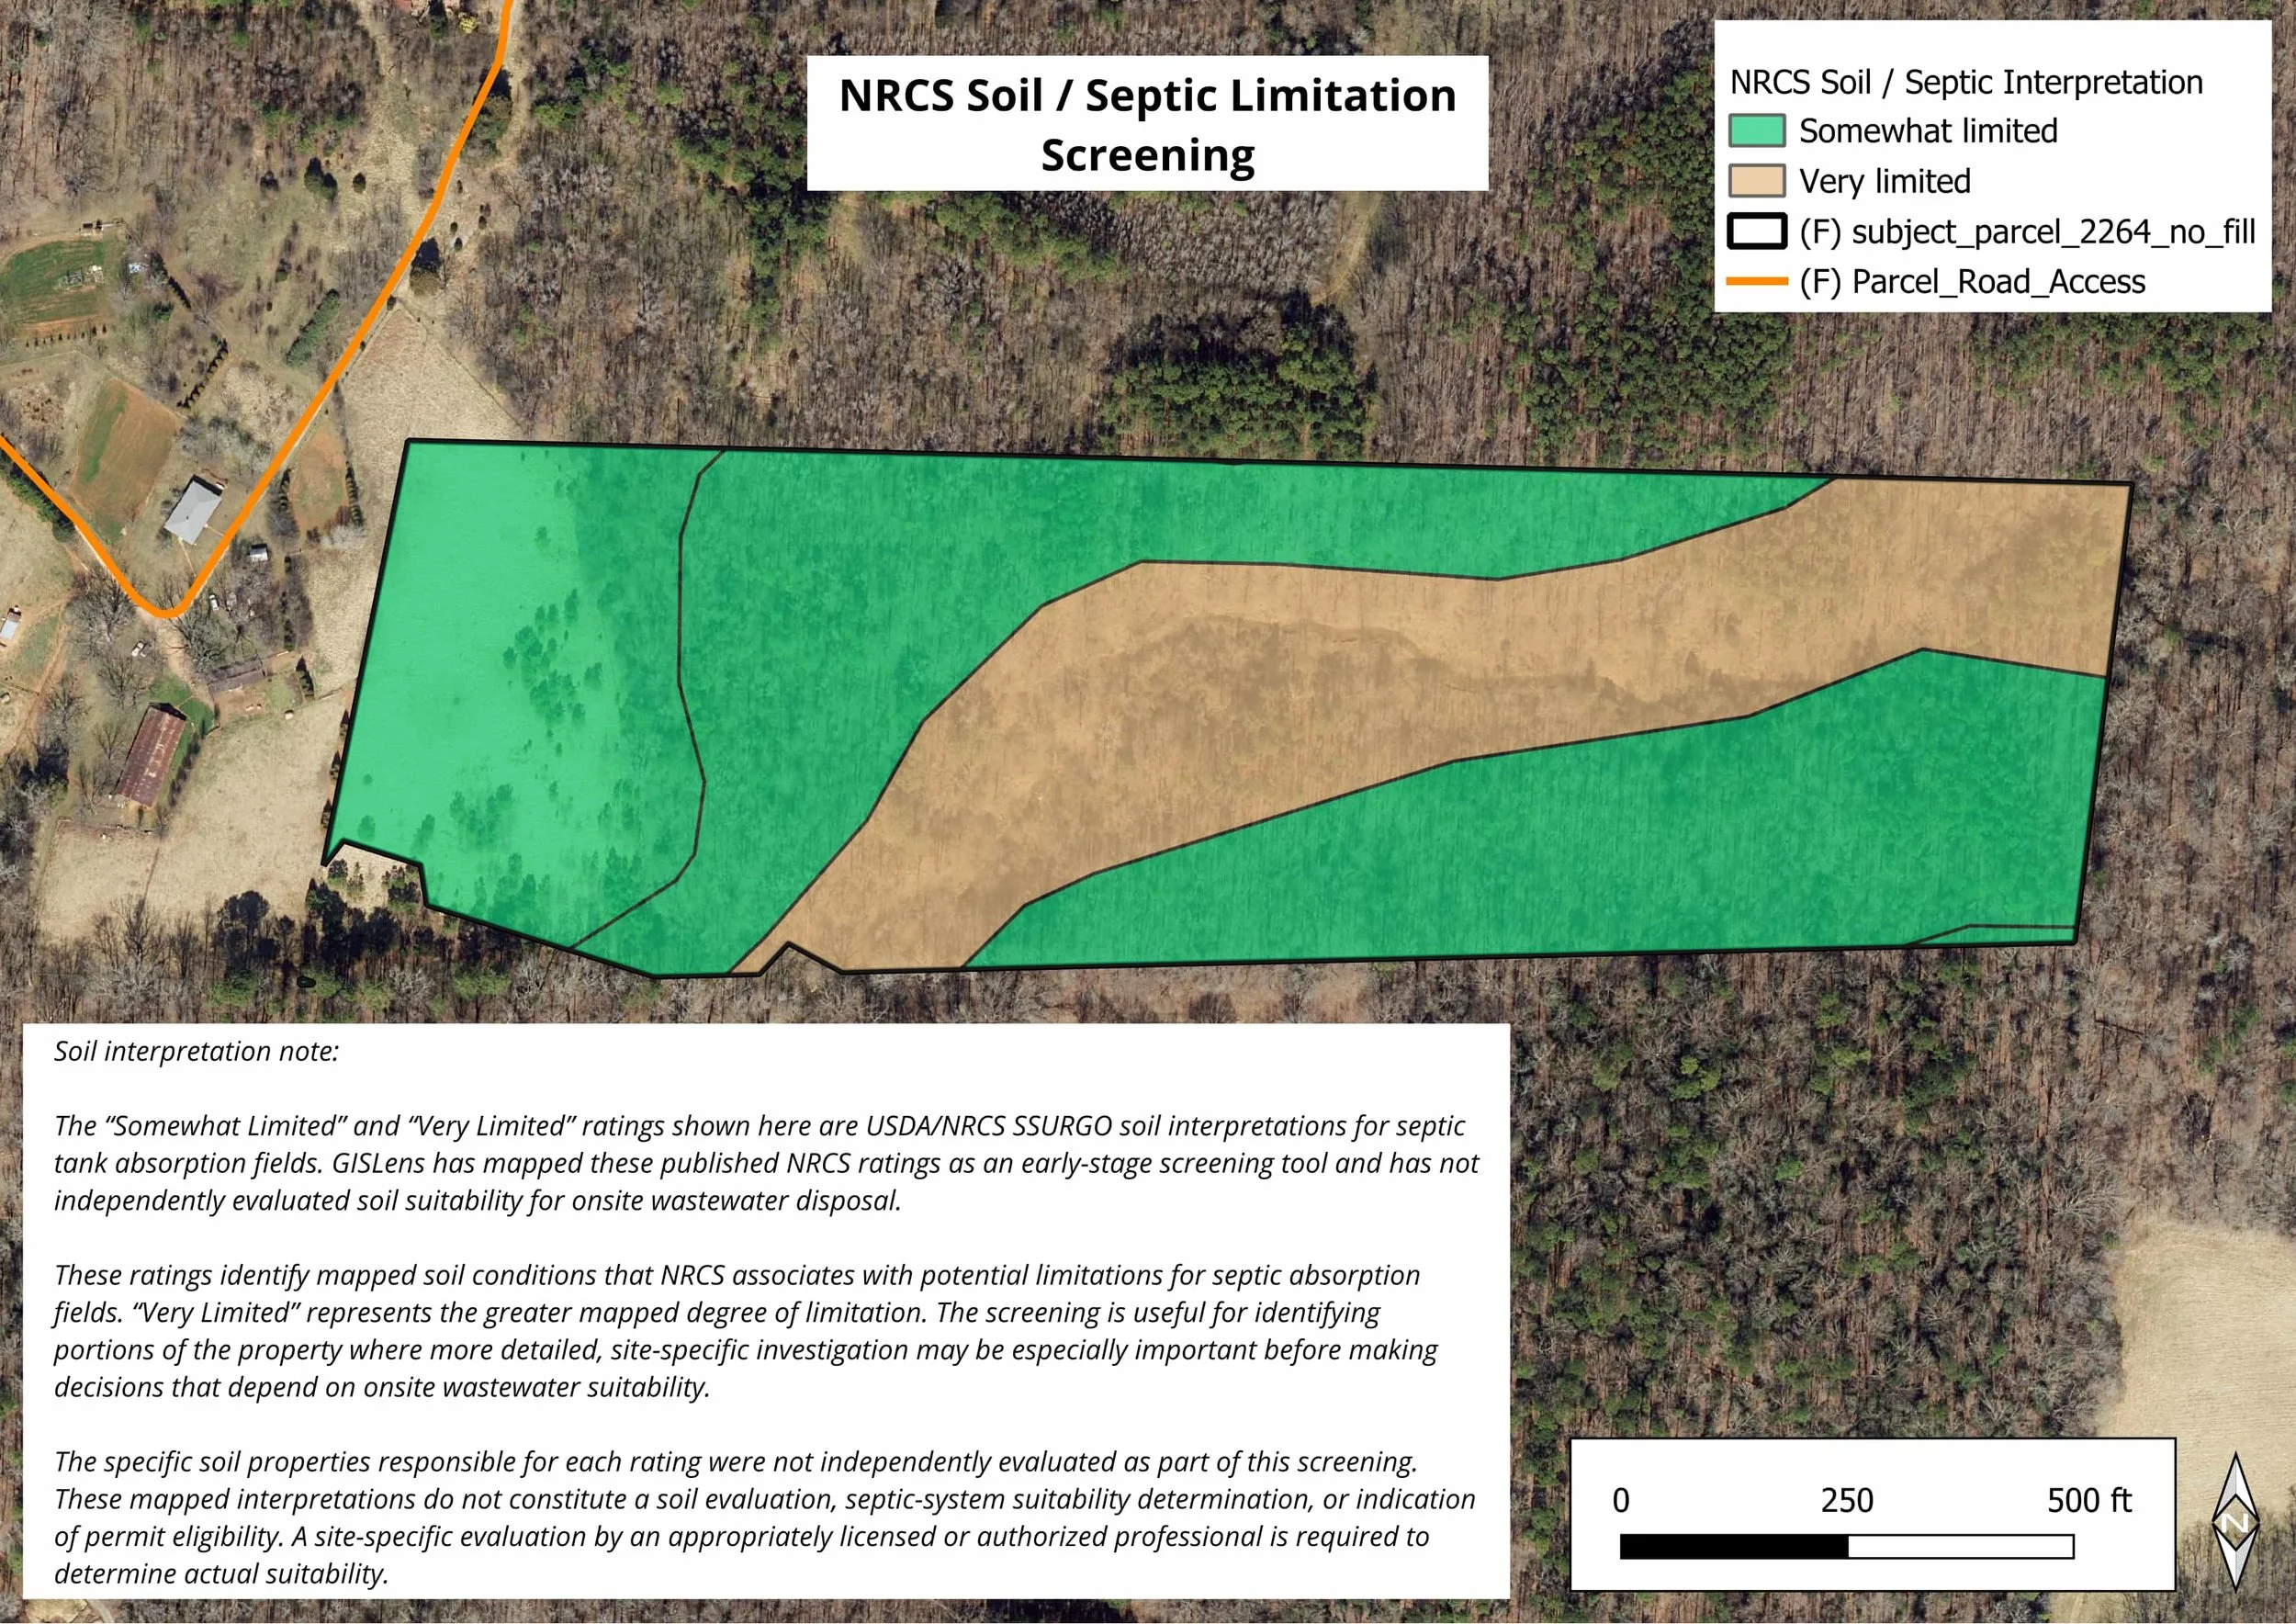
Soil Limitation Screening: Published NRCS soil interpretations mapped across the subject parcel, including areas rated Somewhat Limited and Very Limited for septic tank absorption fields.
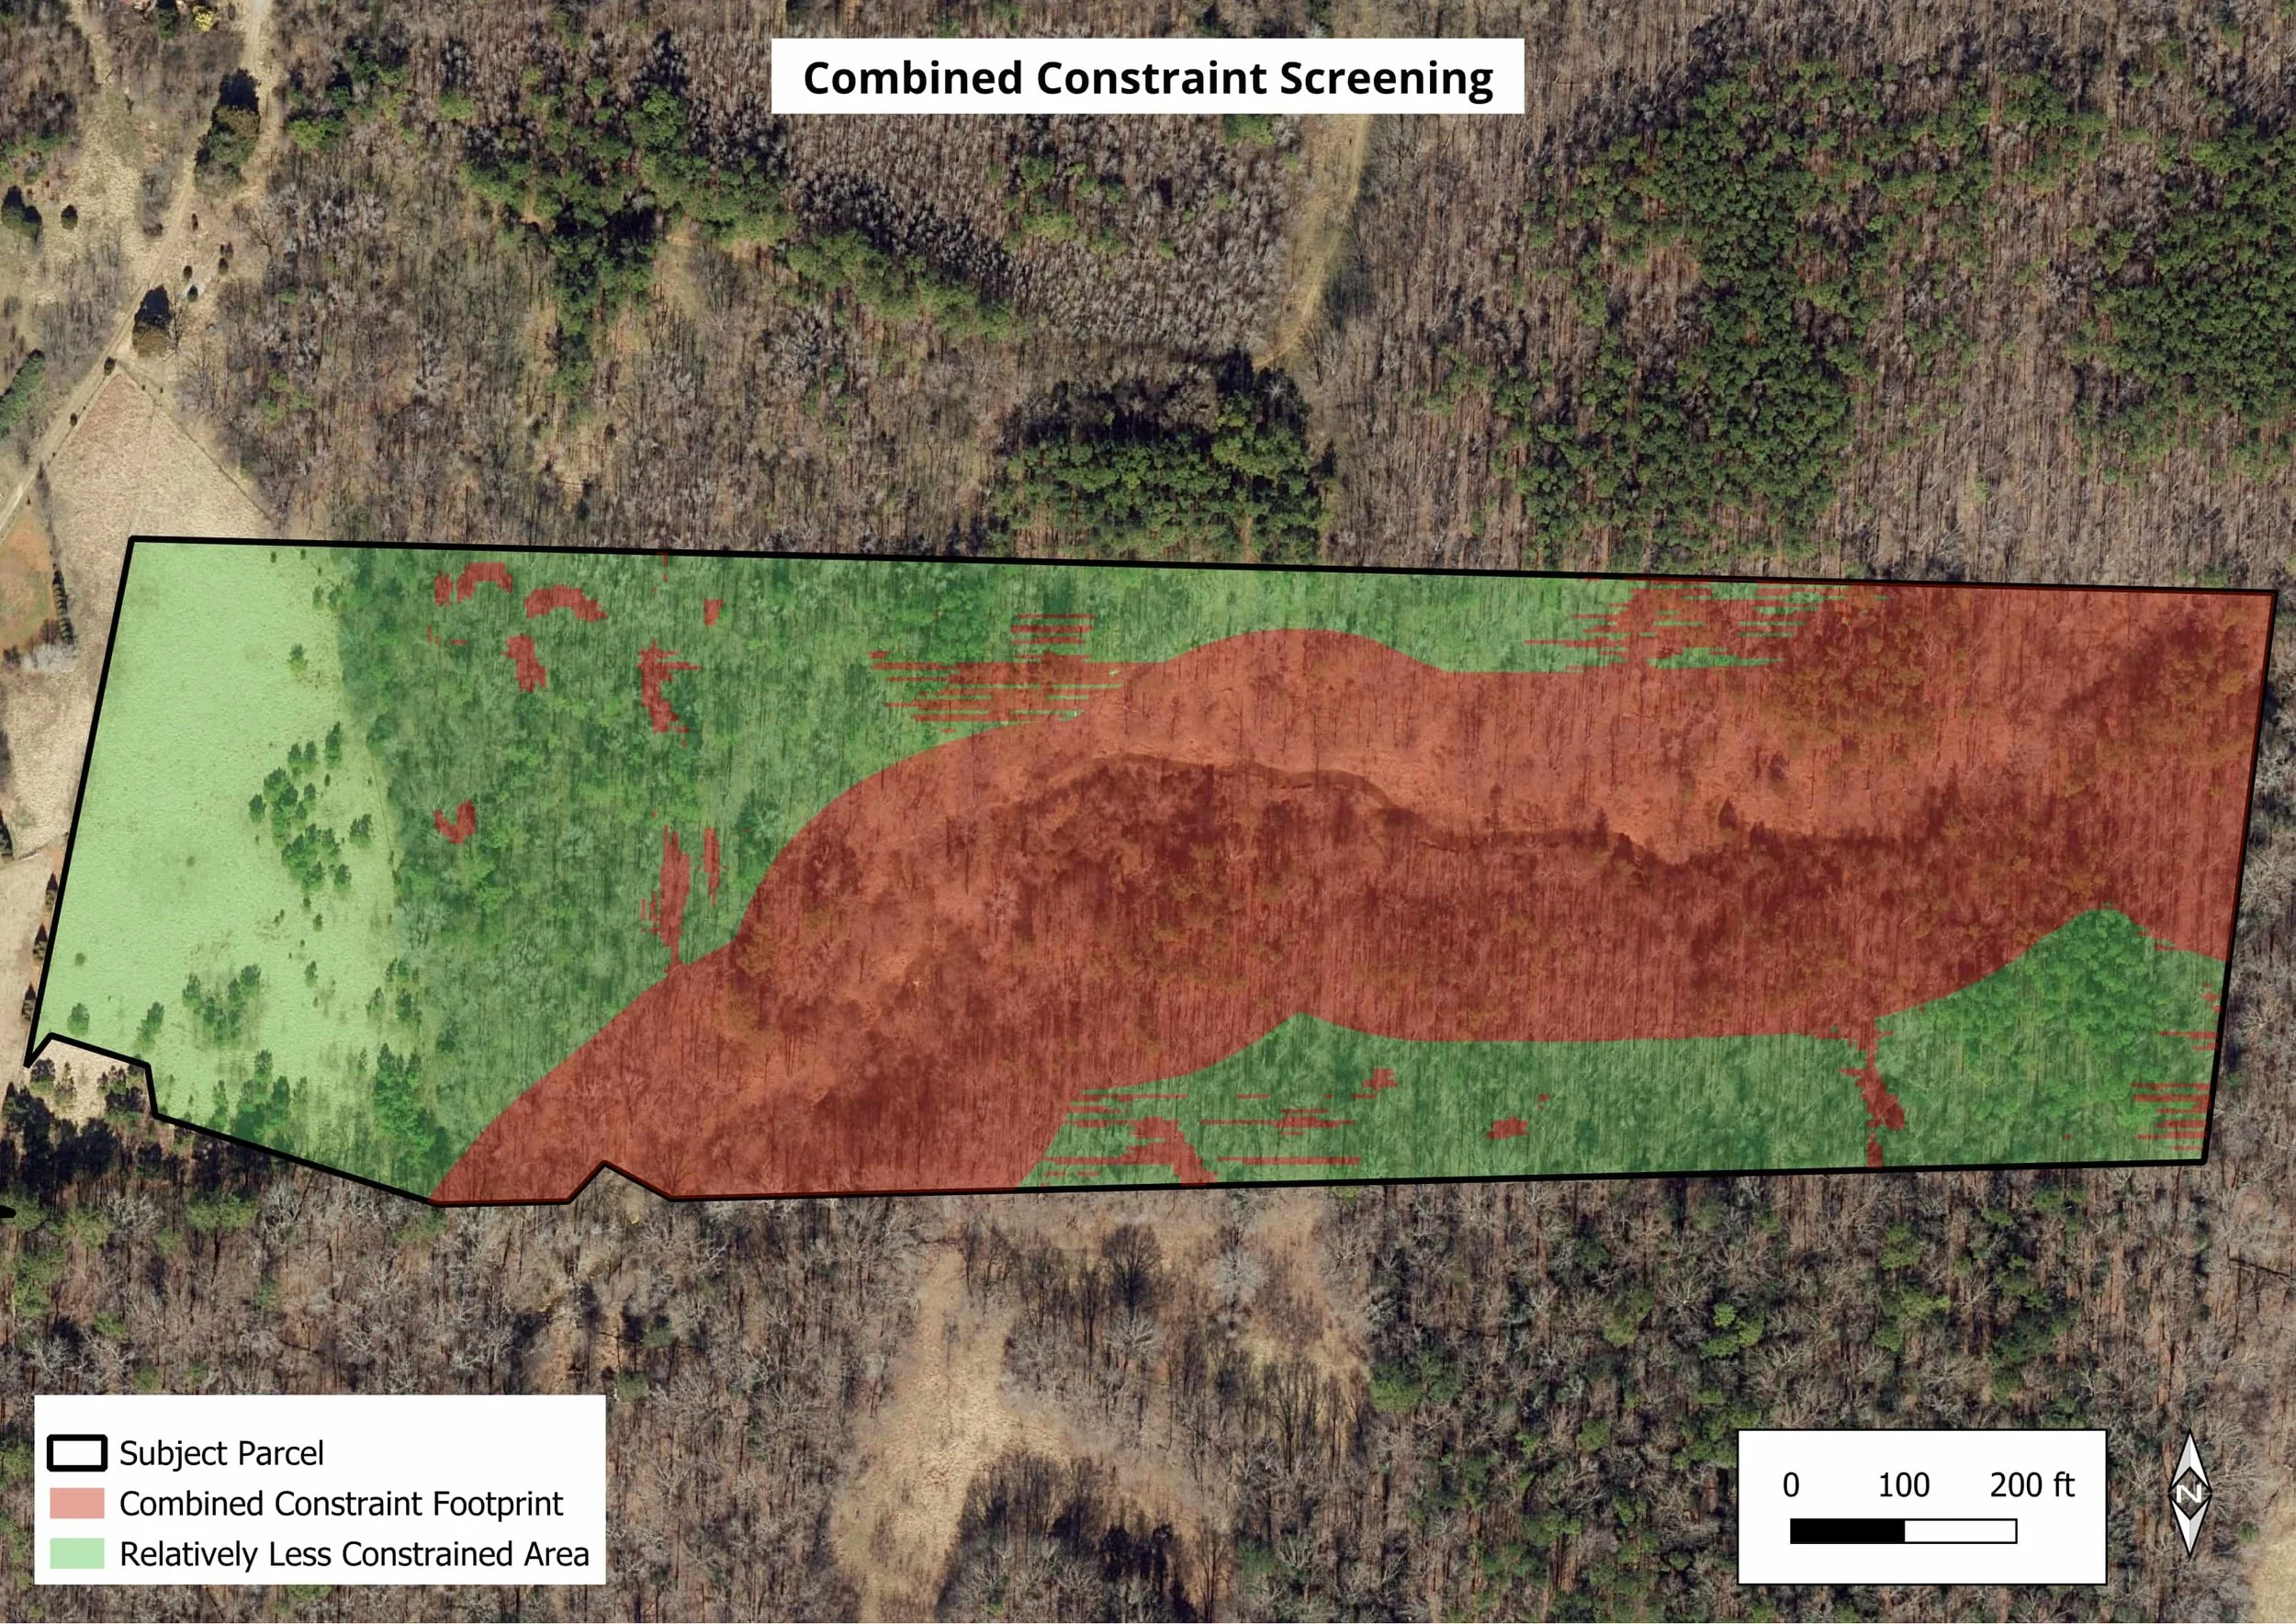
Combined Constraint Screening: Mapped wetlands, a 50-ft stream screening buffer, and slopes greater than 15% are brought together to show where selected constraints overlap—and where the parcel appears relatively less constrained.
1. Identify the Property
Send the parcel location and tell me what you are trying to understand, evaluate, or plan for.
2. Define the Screening
Confirm the relevant questions, available data, analysis scope, deliverables, timing, and cost before work begins.
3. Analyze the Site
Bring together parcel, access, hydrology, terrain, environmental, and other relevant spatial data to evaluate the property.
4. Receive Maps & Findings
Receive clear exhibits and concise findings showing potential constraints, site context, and areas that may warrant closer review.